Indicator 14a: Bryophyte nitrogen
What is it?
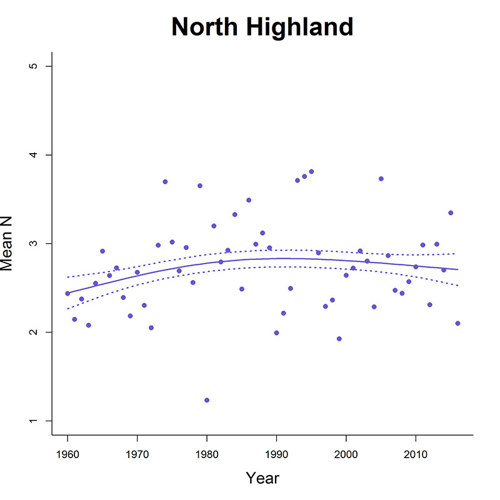
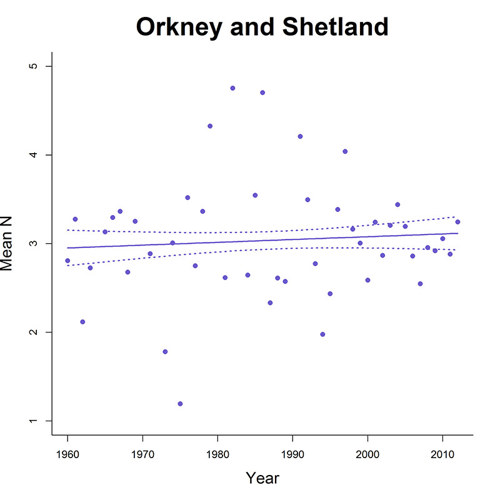
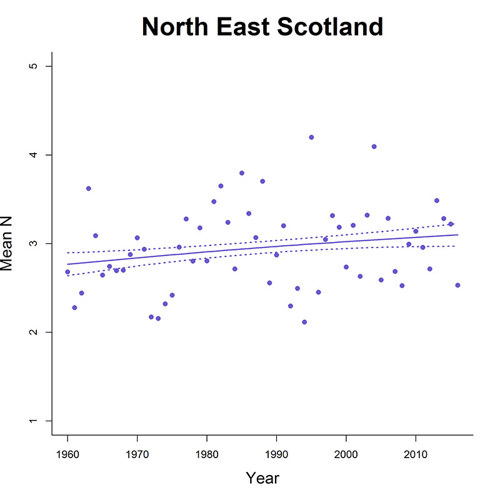
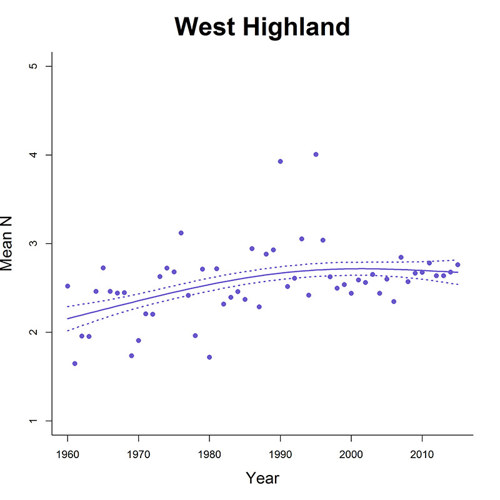
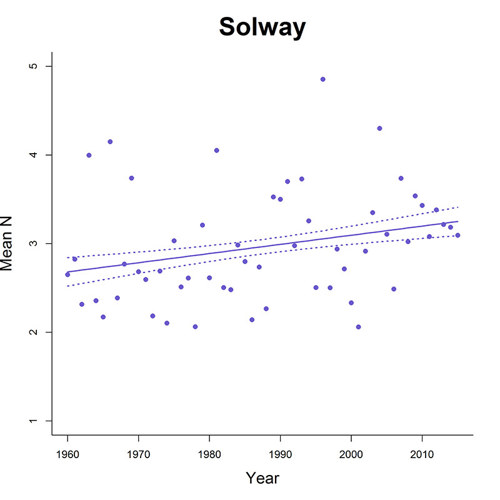
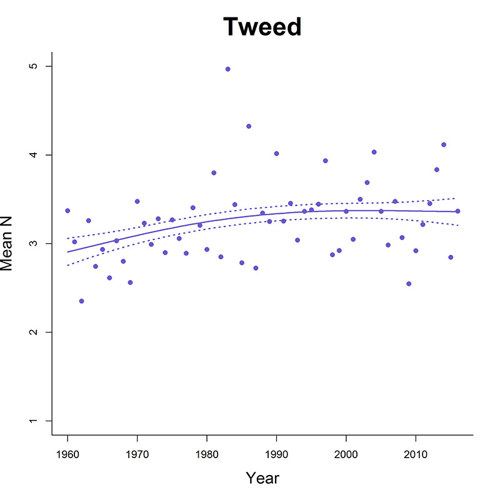
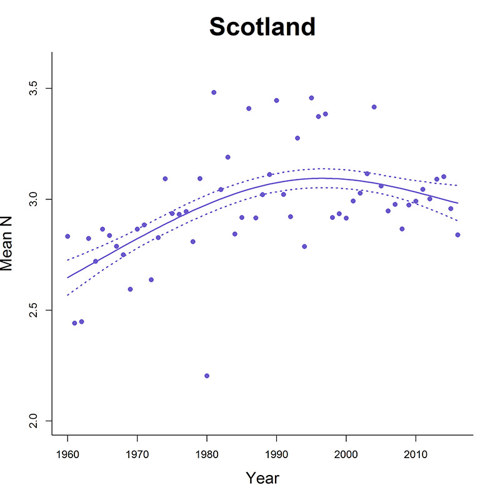
This indicator has been created by linking bryophyte (moss and liverwort) records in the National Biodiversity Network (NBN) to information on the habitat preferences of the different species from BRYOATT. For nitrogen, each bryophyte has been assigned an indicator value between 1 (very infertile conditions) to 9 (very fertile conditions). The value for each year has been calculated by first averaging these indicators within each 10 km grid square and then averaging across them all to create a mean value for Scotland or for the individual sub-catchments.
The high variability between years reflects the different effort of recorders in different places and in different years. However, the relatively narrow spread of the confidence intervals suggests that the trends shown are robust.
Explore the data
Below are graphs showing the Bryophyte Summer Temperature data
How do I interpret the data?
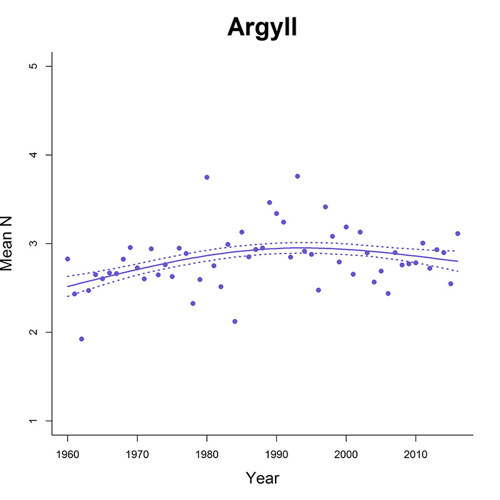
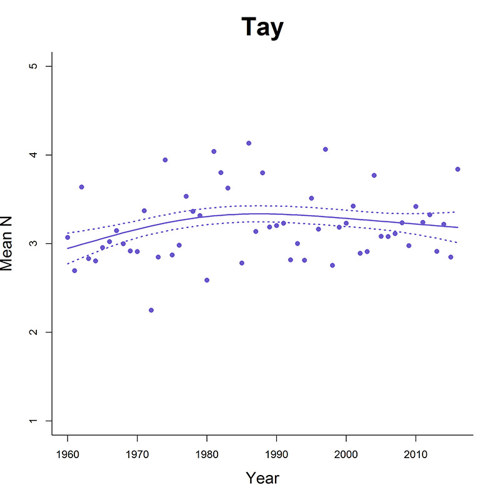
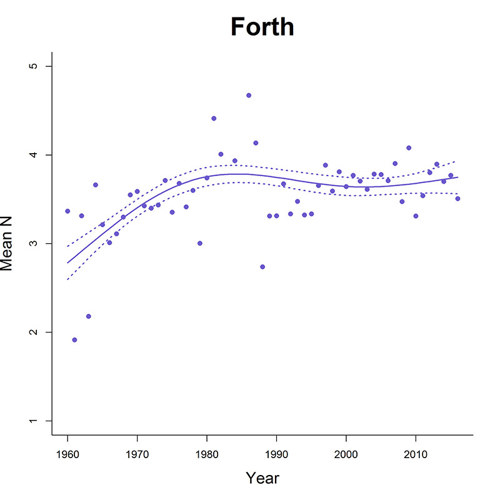
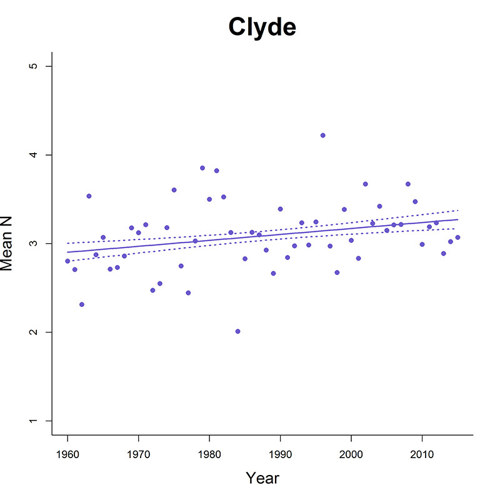
A rise in the mean indicator value provides good evidence that habitats are becoming more fertile/productive. This nitrogen could come from increased fertiliser use, but as most bryophytes are recorded in semi-natural habitats then changes largely reflect changes in atmospheric nitrogen pollution. The main graph for Scotland suggests that the impacts of nitrogen pollution on habitats has been declining since the late 1990’s as the mean indicator value of mosses recorded has fallen. This decline mirrors the fall in actual nitrogen pollution but lags a few years as nitrogen pollution peaked around 1990.
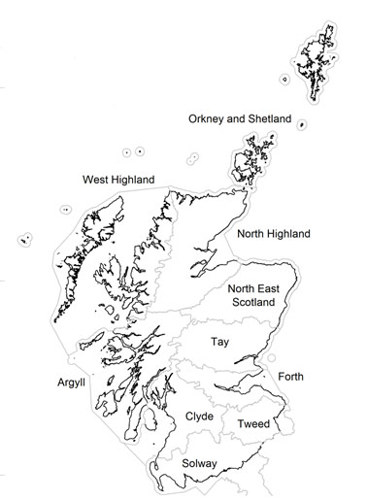
For the sub-catchments, because of reduced power there was only good evidence for a decline for Argyll. However, the data suggest that for Clyde and Forth, in particular, N indicator values continue to increase through time. The data also show that N indicator values are in general lower for Argyll, North Highland and West Highland (generally < 3) and substantially higher for the Forth catchment (approaching 4), reflecting their different pollution and land use histories.
Further explanation as to the development and interpretation of the indicator can be found in Using species records and ecological attributes of bryophytes to develop an ecosystem health indicator
Who is responsible for this indicator?
This indicator has been prepared by the James Hutton Institute and NatureScot.